CRC Introduction
Published on June 24, 2026 Custom Lightning Report Chart
Custom Lightning Report Chart
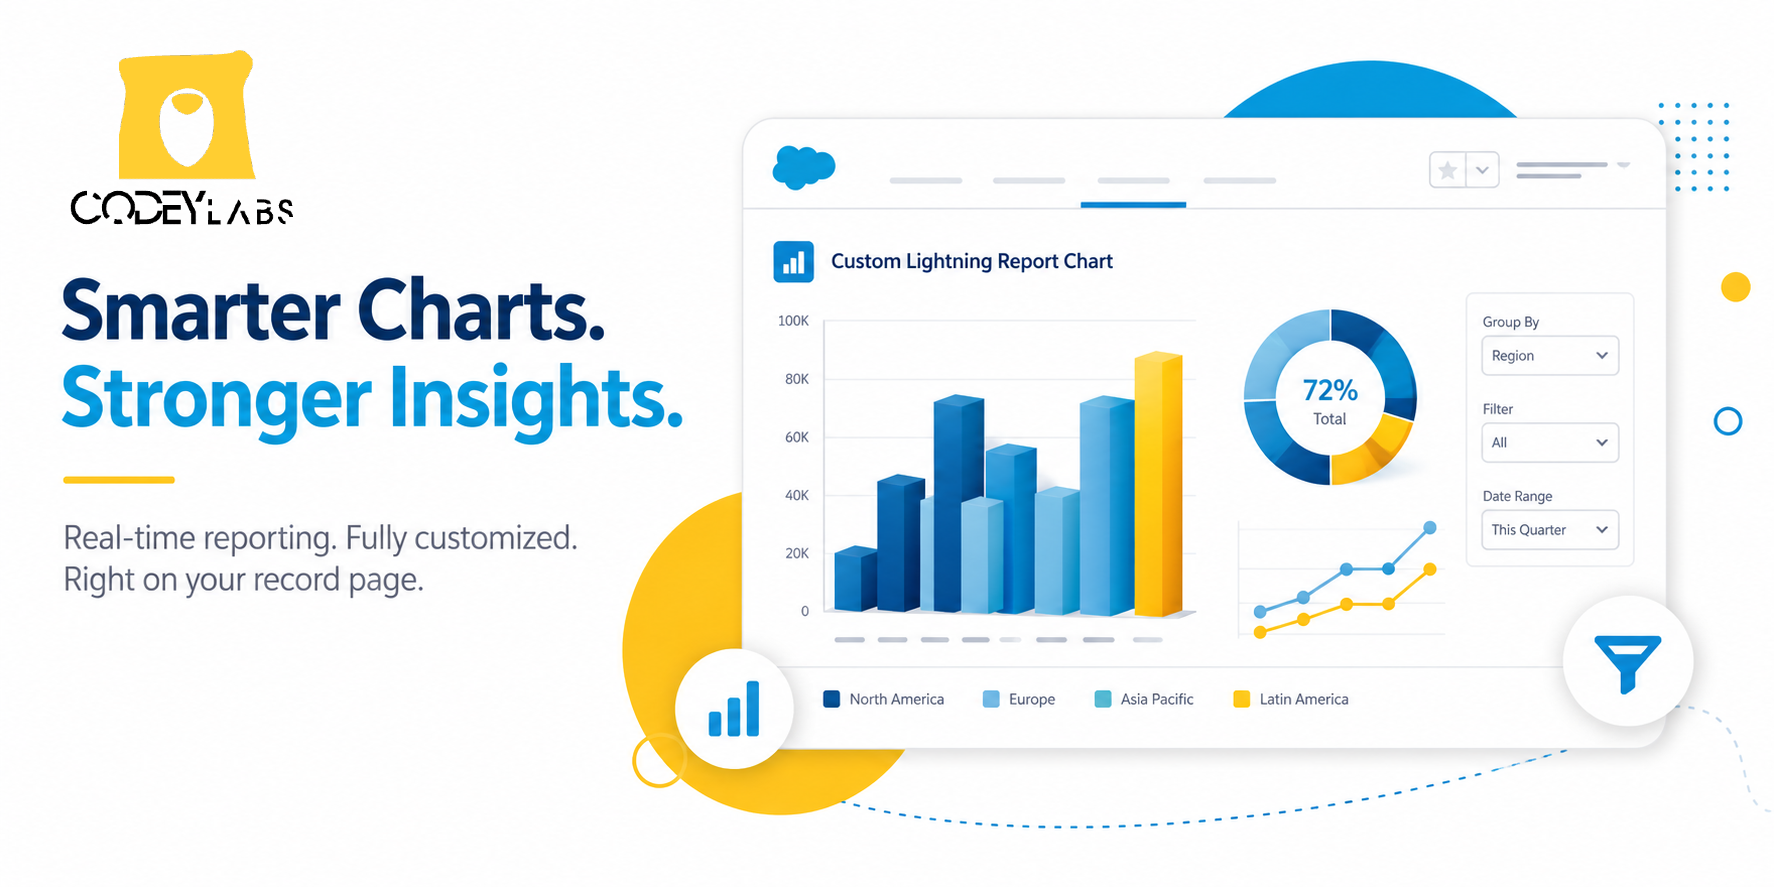
Custom Lightning Report Chart overview
Overview
When Salesforce's native point-and-click report chart features fall short of your needs, try the Custom Lightning Report Chart. Designed for seamless integration and intuitive usability, it offers dynamic updates and a variety of chart types. Clear labeling and smart filtering ensure data comprehension and actionable insights.
Accessible directly from any record page, it supports first or second-level grouping in reports. Whether monitoring sales performance or analyzing campaign effectiveness, it delivers clear, actionable insights in real time or upon refreshing the page layout.
At a glance: Report charts on record pages, more chart types (including 3D bar), smart filtering, and full customization.
Watch the Demo
https://www.youtube.com/watch?v=hCbcK-79uIs
Key Highlights
📊 Enhanced Flexibility
A wider range of chart types, including advanced options like 3D bar charts, lets you visualize data in the most effective way.
🔄 Integrate with Record Pages
Unlike native report charts, the component sits directly on record pages, so users don't need to leave their workflow to see insightful visualizations.
⏱️ Real-Time Updates
Dynamic updates and interactive features, such as smart filtering and group index visualization, give real-time insights for better decisions.
⚙️ Customization and Accessibility
Extensive options, from labeling and legend positioning to permission controls, let you tailor visualizations to your needs.
Knowledge Article Number: KA-00314